From the workshop
We Tested Our Boxing Simulator Against 179 Real Fights
Seventy-five percent of winners, odds that mean what they say, and an honest list of the fights it got badly wrong: what a backtest tells you about a boxing simulator.
Anyone can build a boxing simulator that produces a winner. The interesting question is whether the winner it produces means anything. If the engine says one boxer is a 70 percent favourite, he should win about seven of every ten such fights, not five and not ten. So we did what we would want any simulator to do before trusting it: we pointed it at real fights and kept score.
The test
The simulator on our homepage rates more than 300 boxers, past and present, on twelve attributes and adds a handful of fight-specific factors: reach, stance, a style matchup table and a “puncher’s chance” for the hardest hitters. For every pairing it produces a probability that each boxer wins.
We collected 179 real results between boxers who are both on the roster: modern title fights such as Usyk against Fury, Crawford against Spence and Canelo against Golovkin, as well as historical ones such as Lewis against Tyson and Spinks against Holmes. Rematches count as separate fights. Draws and no-contests are left out, and so are results later overturned: Ryan Garcia’s 2024 win over Devin Haney, changed to a no-contest after a failed drug test, was in our list until we checked it for this article. Then we asked the engine, for each fight, how likely the real winner was to win, and measured three things:
- Accuracy: how often the real winner was the engine’s favourite.
- Brier score: the average squared error of the probability. A coin flip scores 0.25; a perfect oracle scores 0. It punishes confident mistakes much more than cautious ones.
- Calibration: whether the engine’s 60 percents happen 60 percent of the time.
An honest caveat before the numbers. Our ratings are set by hand from each boxer’s whole career, and those careers include many of these fights. This is not a blind forecast made the week before each bout; it is a consistency check. It tells you whether the engine turns ratings into sensible odds, not whether it would have called the fight in advance. Any simulator that rates historical boxers has this problem, and it is better to say so than to quote 75 percent as a betting record.
The headline: 75 percent, and the odds mean what they say
The engine had the eventual winner as favourite in 135 of 179 fights (75.4%), with a Brier score of 0.173, against 50% and 0.250 for a coin flip.
Accuracy alone can be gamed by a model that is always overconfident. Calibration is the more important test, and it is the one we are proudest of:
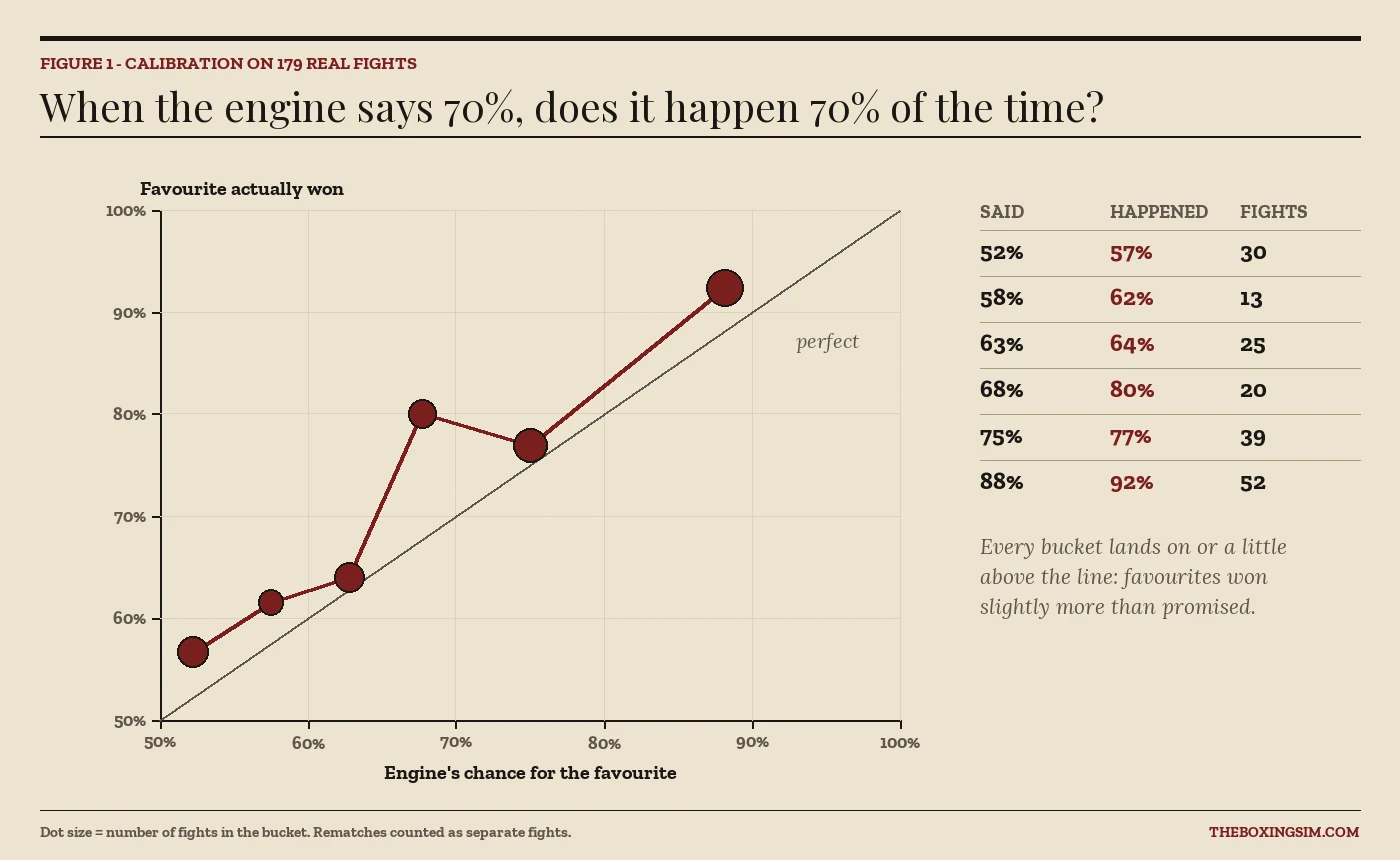
Fights the engine rated as near coin flips (52 percent on average) went to the favourite 57 percent of the time. Fights it rated 75 percent went to the favourite 77 percent of the time. Its most confident calls, averaging 88 percent, came in 92 percent of the time. Every bucket is on the line or a little above it, which means the engine is, if anything, slightly too cautious. That is the right side to err on for a game: a simulator that is too sure of itself never produces the upsets that make boxing worth watching.
What each part of the engine is worth
The most useful thing a backtest can do is tell you which ideas earn their place. We switched each fight-specific factor off in turn and ran the 179 fights again.
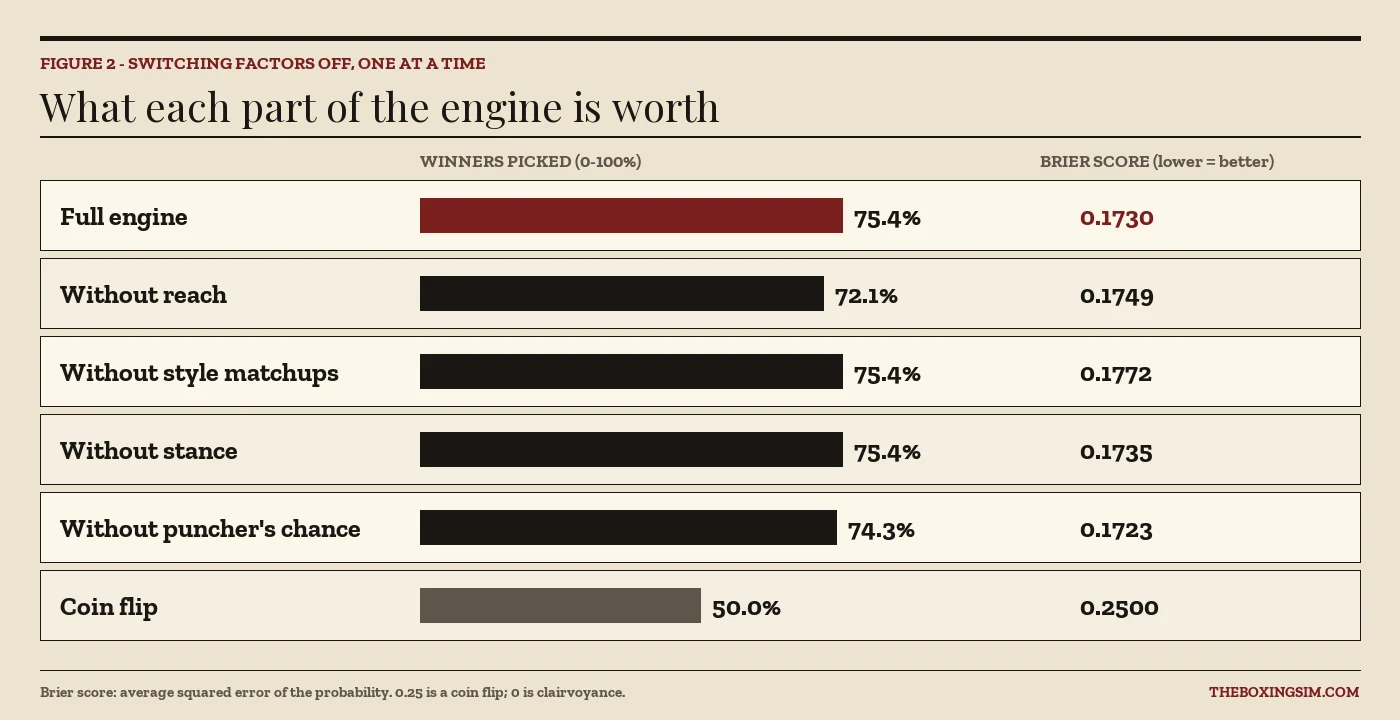
- Reach is the biggest factor. Without it, accuracy falls from 75.4% to 72.1%, six fights flipping the wrong way. Most of those are fights where a longer boxer controlled range against a shorter one with similar ratings, which is exactly what reach does in a real ring.
- Style matchups sharpen the odds. Switching off the style table does not change a single pick, but the Brier score worsens from 0.1730 to 0.1772, the largest drop of any factor. Styles move a 60-40 fight to 65-35, or back to 55-45, and they move it in the right direction more often than not.
- Stance is a small edge. The southpaw factor improves the Brier score a little (0.1735 without it) and changes no picks. That fits the conventional wisdom: being left-handed helps, but it rarely decides fights between elite boxers who have seen plenty of southpaws.
- The puncher’s chance is a trade. Without it, the engine picks two fewer winners correctly but its Brier score is fractionally better (0.1723). It helps in fights where a big hitter really did land the shot, and costs us when he did not. We keep it because it makes simulated fights feel like boxing, where the man with the heaviest hands is never out of it, but the test is a reminder that this is a design choice, not a statistical one.
We also tested how steeply the engine turns a ratings gap into odds. A gentler curve picked fewer winners (72.6% at the softest setting we tried); a steeper one improved the Brier score very slightly but would make mismatches on the roster feel like foregone conclusions. We stayed in the middle.
The fights you remember
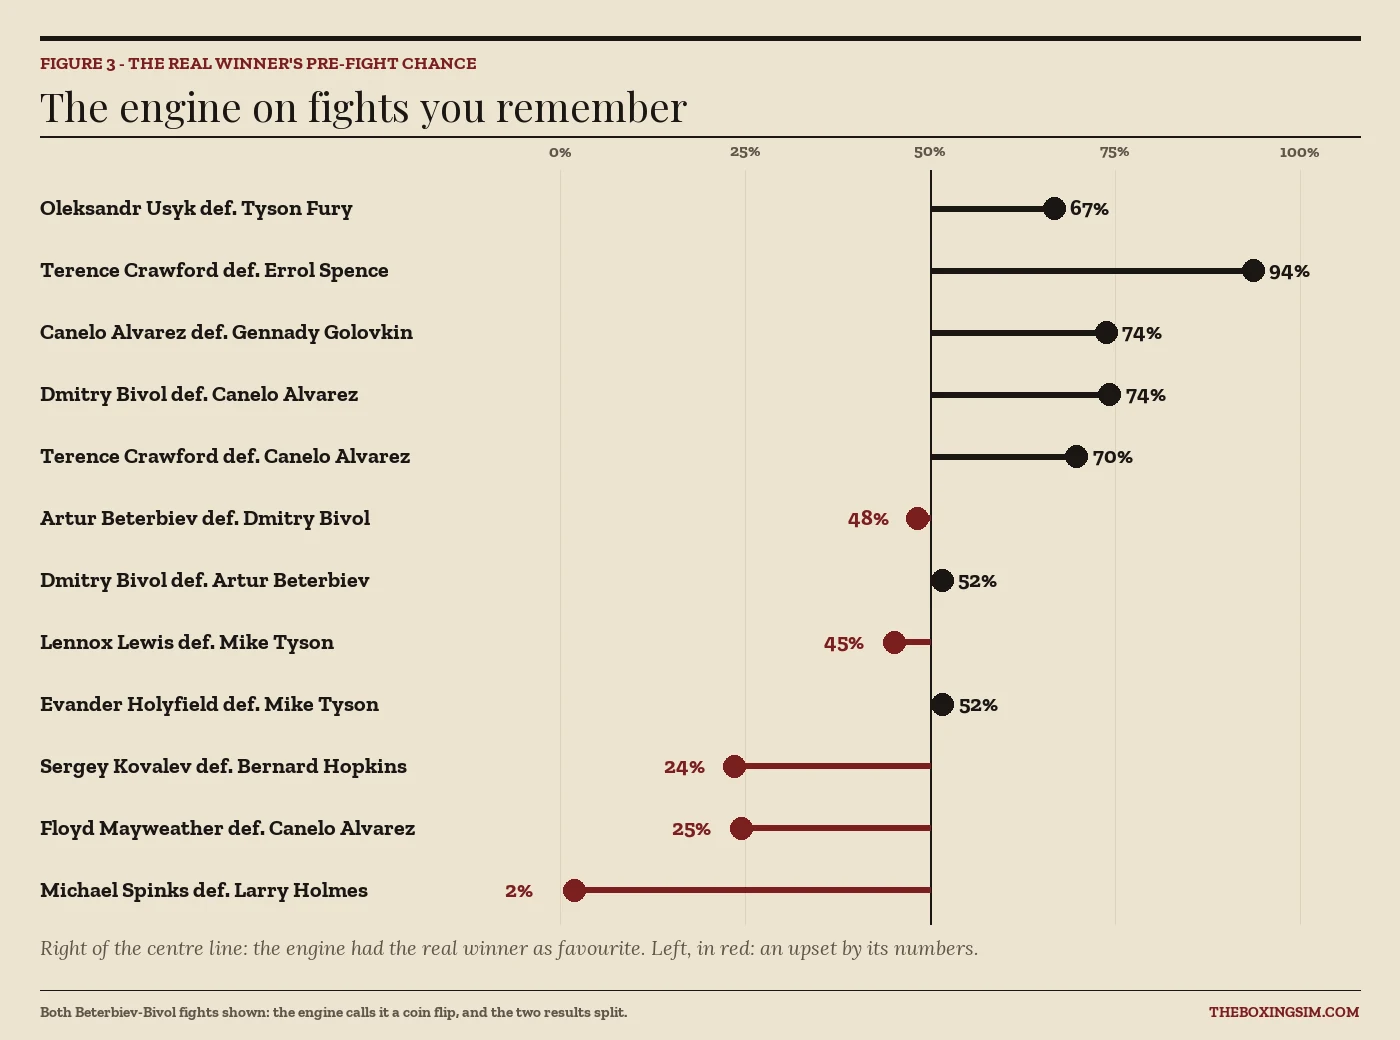
A few results are worth a closer look.
Usyk over Fury (67%). The engine likes Usyk’s ratings across the board but gives real weight to Fury’s size and reach. Two out of three is a fair summary of fights that were close on the cards.
Beterbiev and Bivol (48% and 52%). Our favourite result in the whole test. The engine treats this as a true coin flip, and the two real fights split, one each way. A model that had confidently picked either man would have been wrong once.
Lewis over Tyson (45%). A narrow miss. The ratings remember Tyson at his peak, and the engine cannot know that the Tyson of 2002 was not that man. This is the most common reason for a historical miss: ratings describe a career, a fight happens on one night.
Mayweather over Canelo (25%). The same problem in reverse. Canelo’s rating reflects the champion he became, not the 23-year-old who met Mayweather in 2013.
The ones it got badly wrong
Every model needs a list like this, and it should be public. The engine’s biggest misses, by the probability it gave the real winner:
- Michael Spinks over Larry Holmes, twice: 2%. A light-heavyweight moving up to beat an unbeaten heavyweight champion is exactly what a ratings-and-size model says should not happen. It did, and then the judges said it happened again.
- Jake LaMotta over Sugar Ray Robinson: 10%. Robinson won five of their six fights; the engine is right about the series and wrong about the one night LaMotta won.
- Erik Morales over Manny Pacquiao: 18%. Another series problem: Pacquiao won the two rematches, and his career rating reflects that.
- Dmitry Bivol over Gilberto Ramírez: 20%. The model is too impressed by Ramírez’s size and unbeaten record against a better boxer.
- Sergey Kovalev over Bernard Hopkins: 24%. Hopkins was 49. His rating is the Hopkins of a twenty-year career, not the man in the ring that night.
Notice the pattern. The biggest misses are not random. They are first fights in a series the loser went on to dominate, fights involving a big jump in weight, and fights where age had arrived before the rating noticed. Knowing that is useful: it is a list of where to look the next time we touch the engine.
Do the knockouts look right?
Picking winners is half the job. A simulator also has to finish fights at believable rates: Deontay Wilder should not be winning on points, and a slick boxer with a 40 percent knockout rate should not be flattening everyone. So we ran a second test. For each of the 338 boxers on the roster with at least 15 professional wins, we simulated 1,500 twelve-round fights against the other boxers in his division and counted how many of his wins came inside the distance.
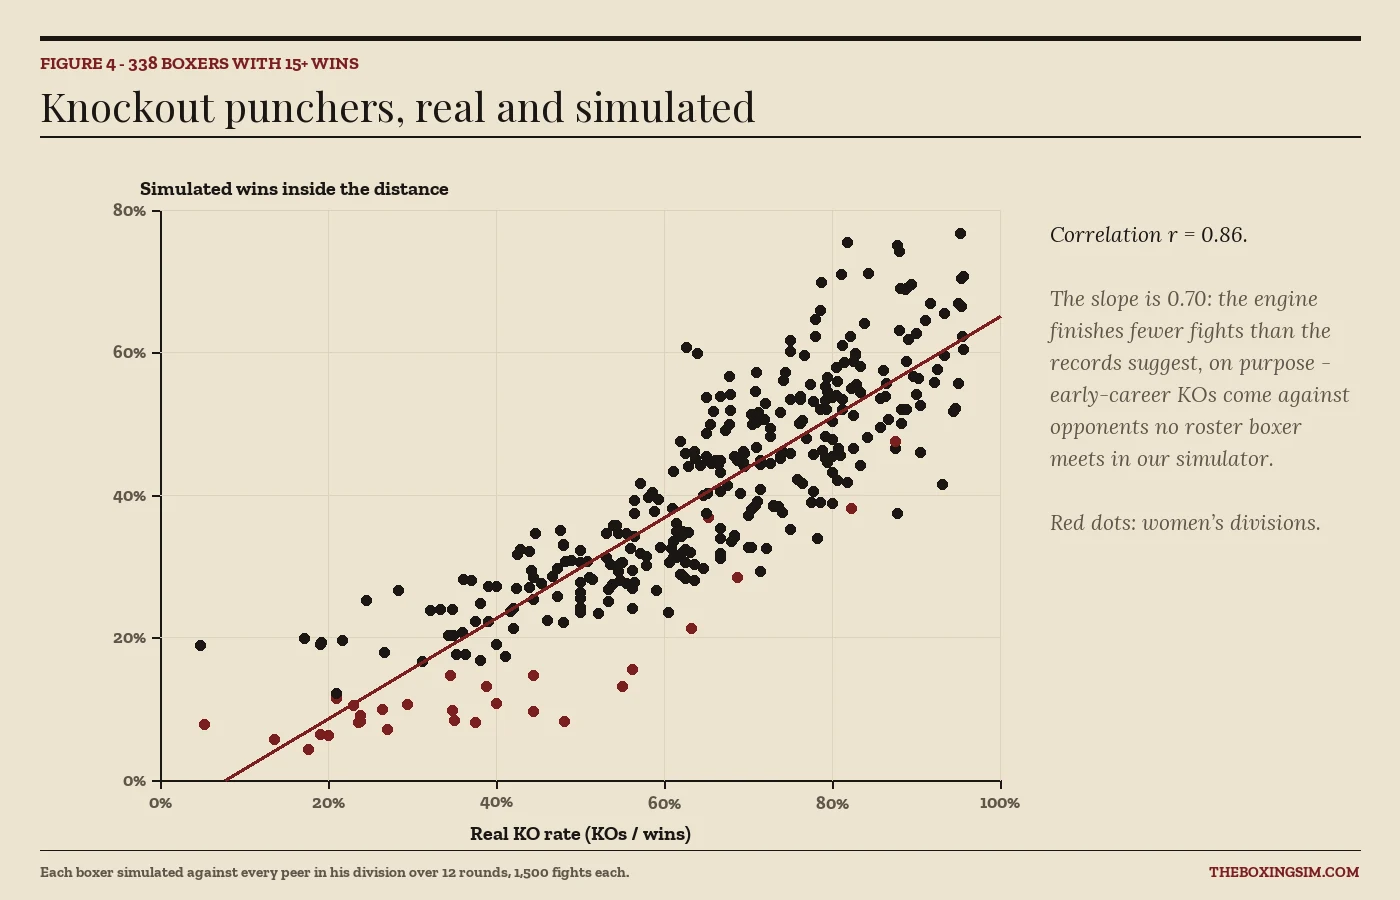
The correlation is 0.86: the boxers who knock people out in real life are the ones who knock people out in the simulator. The slope is 0.70, meaning a boxer with an 80 percent real knockout rate finishes about 56 percent of his simulated wins. That gap is deliberate. A real record includes the early-career fights against opponents chosen to be beaten, and those end early. In the simulator every opponent is a ranked contender or a champion, and real knockout rates fall in that company too.
The biggest outliers are easy to name. The engine under-finishes a few boxers with knockout rates above 85 percent, many of whose wins came on regional cards, and over-finishes a handful of technical boxers with very few knockouts on their records. Women’s divisions sit mostly below the line: the engine finishes their fights less often than their records do, and that is the next thing on our list to look at.
What we changed because of it
- The odds curve. An earlier run on 111 fights showed that a steeper conversion of ratings into odds beat the softer one we had shipped, so we changed it. On the larger set an even steeper curve helps a little more, but not enough to justify making the gap between champions and contenders feel unbridgeable.
- Knockout calibration. When we first built the knockout test the correlation was 0.71. Two changes took it to 0.86: each boxer’s real knockout record now counts for more, and an old rule that made heavyweight fights end early more often was removed. It double-counted something the records already knew, and it left the smaller divisions finishing about ten points below their real rates.
- The test suite. We rerun both tests whenever the engine changes. When we add real fights to the list, they go into the same file, so the numbers in this article will move. That is how it should be.
Try to beat it
The best way to understand a model is to argue with it. Pick a fight you think the engine gets wrong, run it a few dozen times, and see how often your man wins. If the result still looks wrong to you, tell us through the contact page, and we will add the fight to the test set.
RUN A FIGHT IN THE SIMULATOR →
For how those simulated fights are scored round by round, see how boxing is scored. For how the same engine feels from inside a career, read designing Boxing Career.
Frequently asked questions
- How accurate is The Boxing Sim?
- Against 179 real fights between boxers on our roster, the engine made the eventual winner the favourite 75% of the time. Its probabilities are well calibrated: fights it rated around 75% went to the favourite 77% of the time.
- What matters most in the boxing simulator?
- The ratings themselves do most of the work. Of the extra factors, reach mattered most in our test: switching it off cut accuracy from 75.4% to 72.1%. Style matchups improved the quality of the probabilities without changing many picks.
- Can the simulator predict upsets?
- Not reliably, and no honest model can. It gave Michael Spinks a 2% chance against Larry Holmes and Jake LaMotta 10% against Sugar Ray Robinson. Upsets in the simulator happen at roughly the rate its odds say they should.
- Does the simulator know the real results?
- Partly. The ratings are set by hand from each boxer’s whole career, which includes these fights, so this is a consistency check rather than a blind forecast. It shows the engine turns ratings into sensible odds, not that it could have called each fight in advance.
- How often does the simulator produce knockouts?
- In line with real records but a little lower. Across 338 boxers the simulated knockout rate tracks the real one closely (correlation 0.86), at about 70% of the record, because early-career knockouts come against weaker opposition than the roster.